Semantic modeling of data science code
Evan Patterson
Stanford University, Statistics Department
Ioana Baldini, Aleksandra Mojsilović, Kush R. Varshney
IBM Research AI
PyData NYC
November 4, 2019
Communicating data analysis...
...to people, with varying backgrounds, professional roles, and levels of expertise
...to machines, for the sake of:
- Summarization or visualization
- Meta-analysis or meta-learning
- Mining the scientific literature
Not independent: Machine understanding is the means, human understanding is the end.
Communicating data analysis, the traditional way
Communicating data analysis, the traditional way
Benefits of the traditional scientific report:
- Optimized for readability by humans
Problems:
- Model explorability is severely limited
- Important details may be omitted, hindering reproducibility
- Machine processing is extremely difficult
Communicating data analysis, today
Communicating data analysis, today
Computational notebooks like Jupyter and R Markdown improve:
- Model explorability and interactivity
- Reproducibility
However:
- Exposition is often lacking
- Code may be hard to understand
The challenge of fragmentation
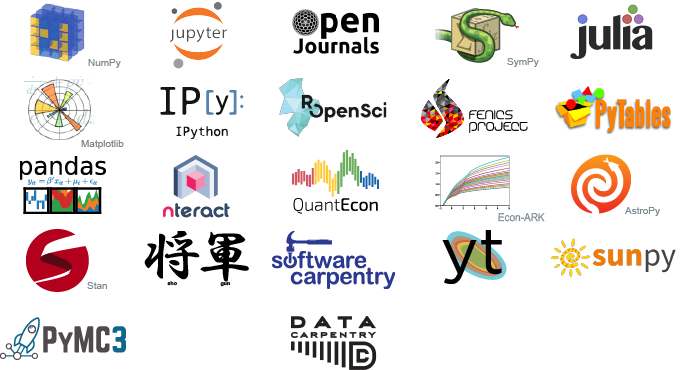
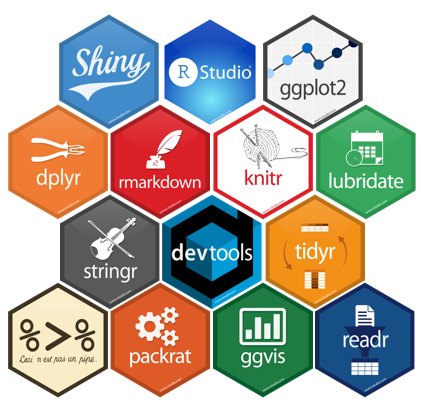
Understanding the code is hard because data science is a big tent, encompassing different:
- disciplines
- statistics and machine learning
- software and data engineering
- special sciences: biomedicine, physics, ...
- programming languages
- general: Python, R, Julia, ...
- DSLs: BUGS, Stan, ...
- frameworks and packages
- PyData: pandas, sklearn, statsmodels, ...
- Base R and the tidyverse
- Deep learning: TensorFlow, Caffe, Torch, ...
Communicating data analysis, the future
Open source and open science are producing ever more data science code.
But once it is published, how do we utilize it?
To help people share the results of data analysis, and machines process it, we need a model of data science code that is
- machine-interpretable
- language- and library-agnostic
- not too hard to generate
Goal: Create semantic models of data science code, with minimal human intervention.
Plan of talk
- Examples
- Methodology in brief
- Program analysis
- Semantic enrichment
- Future directions
Example #1: Toy code
k-means clustering using NumPy and SciPy
import numpy as np
from scipy.cluster.vq import kmeans2

iris = np.genfromtxt('iris.csv', dtype='f8', delimiter=',', skip_header=1)
iris = np.delete(iris, 4, axis=1)

centroids, clusters = kmeans2(iris, 3)
k-means clustering using pandas and scikit-learn
import pandas as pd
from sklearn.cluster import KMeans

iris = pd.read_csv('iris.csv')
iris = iris.drop('Species', 1)

kmeans = KMeans(n_clusters=3).fit(iris.values)
centroids = kmeans.cluster_centers_
clusters = kmeans.labels_
iris = read.csv("datasets/iris.csv", stringsAsFactors=FALSE)
iris = iris[, names(iris) != "Species"]

km = kmeans(iris, 3)
centroids = km$centers
clusters = km$cluster
How are the three scripts related?
- Different syntactically: different programming languages, different packages
- Equivalent semantically
Example #1: Semantic flow graph for all three scripts

Example #2: DREAM Challenge
A real data analysis from the DREAM Challenge for rheumatoid arthritis (RA):
- Question: how well do clinical and genetic covariates predict RA patient response to treatment?
- Process: Contestants submit two models:
- With clinical covariates only
- With both clinical and genetic covariates
- Finding: Genetic covariates don't meaningfully increase predictive power
We analyze one top-ranking submission, written in R.
Example #2: R code
library("caret")
library("VIF")
library("Cubist")

merge.p.with.template <- function(p){
  template = read.csv("RAchallenge_Q1_final_template.csv")
  template$row = 1:nrow(template)
  template = template[,c(1,3)]

  ids = data.resp$IID[is.na(y)]
  p = data.frame(ID=ids, Response.deltaDAS=p)
  p = merge(template, p)
  p = p[order(p$row), ]
  p[,c(1,3)]
}

data = readRDS("pred.rds")
resp = readRDS("resp.rds")

# non-clinical model
data.resp = merge(data, resp[c("FID", "IID", "Response.deltaDAS")])
y = data.resp$Response.deltaDAS
y.training = y[!is.na(y)]

data.resp2 = data.resp[!(names(data.resp) %in% c("Response.deltaDAS", "FID", "IID"))]
dummy = predict(dummyVars(~., data=data.resp2), newdata=data.resp2)

dummy.training = dummy[!is.na(y),]
dummy.testing = dummy[is.na(y),]

v = vif(y.training, dummy.training, dw=5, w0=5, trace=F)
dummy.training.selected = as.data.frame(dummy.training[,v$select])
dummy.testing.selected = as.data.frame(dummy.testing[,v$select])

m1 = cubist(dummy.training.selected, y.training, committees=100)
p1 = predict(m1, newdata=dummy.testing.selected)

# clinical model
dummy = data.resp[c("baselineDAS", "Drug", "Age", "Gender", "Mtx")]
dummy = predict(dummyVars(~., data=dummy), newdata=dummy)
dummy.training = dummy[!is.na(y),]
dummy.testing = dummy[is.na(y), ]

m2 = cubist(dummy.training, y.training, committees=100)
p2 = predict(m2, newdata=dummy.testing)

## create csv files
p1.df = merge.p.with.template(p1)
p2.df = merge.p.with.template(p2)

write.csv(p1.df, quote=F, row.names=F, file="clinical_and_genetic.csv")
write.csv(p2.df, quote=F, row.names=F, file="clinical_only.csv")
Example #2: Semantic flow graph

Methodology in a nutshell
How we construct a semantic model of data science code:
Step 1. Dataflow analysis using computer program analysis:
Step 2. Semantic enrichment using knowledge-based methods:
Architecture

Program analysis
- Uses both static and dynamic analysis
- Records raw flow graph, where
- nodes represent function calls
- edges represent objects and their types
Programming model: "Everything that happens [in R] is a function call" (John Chambers)


Program analysis, step 1: Static analysis
In fact, not everything that happens is actually a function call, especially in Python.
In static phase, transform the abstract syntax tree (AST):
- Homogenize code to conform with programming model:
- Python: transform variable read/assigns, attribute getter/setters, etc. into function calls
- R: handle non-standard evaluation
- All languages: handle mutations
- Insert callbacks to trace function calls and arguments
- Python: more reliable than
sys.settrace - R: only supports statistical profiling
- Python: more reliable than
Program analysis, step 2: Dynamic analysis
In dynamic phase, record the raw flow graph by executing the transformed code:
- Graph built in real-time as code runs
- Provenance record must be maintained
Assumption: Data analysis must be executable: need code, data, and environment,
the same requirement for reproducibility.
Semantic enrichment
Problem: Determine the "meaning" (semantics) of data science code.
↯ Simply impossible without restriction of scope.
Assumption: Code uses semantically meaningful classes and functions from standard packages.
Strategy: Express standard classes and functions in terms of universal concepts.
Data Science Ontology
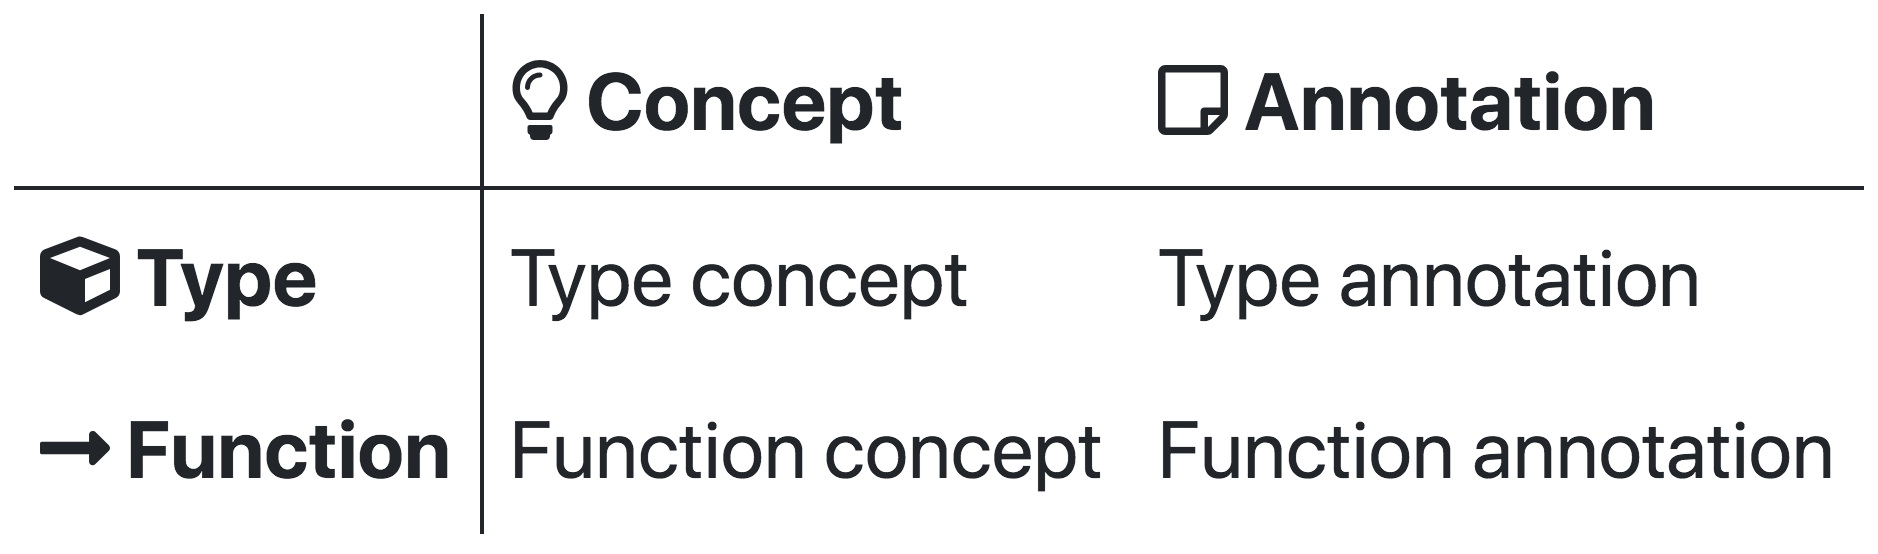
- We are building an ontology comprised of:
- concepts from data science
- annotations mapping code to concepts
- Both come in two flavors:
- types (things that exist)
- functions (things that happen)
Demo: Data Science Ontology
Example concepts
 k-means clustering
 fit supervised model
Example annotations
k-means clustering in scikit-learn
k-means clustering in SciPy
Semantic enrichment algorithm
Assumption: Some code will be unannotated, hence semantics will be partial.
Transform raw flow graph to semantic flow graph:
- Expansion: replace annotated parts with abstract definitions
- Contraction: simplify unannotated parts as much as possible
Architecture: Implemented in Julia, not Python or R, partly for maximal decoupling.
Future directions
- Improve robustness of program analysis
- Python
- R
- Expand the Data Science Ontology
- Manually
- Partial automation, especially for annotations
- Develop user-facing applications and frontends
- Represent internal mathematical structure of models (current work)
Thank you!
Further materials
- Data Science Ontology: www.datascienceontology.org
- Paper: Patterson, Baldini, Mojsilović, Varshney, 2018: Teaching machines to understand data science code by semantic enrichment of dataflow graphs. arXiv:1807.05691
- Code: github.com/epatters
Contributing
We need your help! Please contact me if interested in contributing.